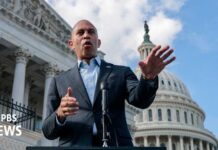

A viral $1.3 trillion “savings” claim about Medicare for All collided with a hard budget warning that says federal costs would still surge.
Story Snapshot
- Rep. Ro Khanna said Medicare for All would cut national health spending by $1.3 trillion.
- A Community Note flagged that federal spending would still rise under many designs.
- Congressional Budget Office ranges show possible savings or higher total costs, depending on details.
- The fight shows how leaders blur “national costs” and “federal costs” to sell plans.
What Khanna Claimed And Why It Caught Fire
On November 18, 2026, Representative Ro Khanna said Medicare for All would lower national health spending from $5.3 trillion to $4.0 trillion, a $1.3 trillion drop. He called it anti-inflation and pro-business. Supporters pointed to a Yale-linked analysis that reportedly found more than $1 trillion in savings from lower overhead and drug prices. Coverage also pointed to advocacy writing from the Sanders Institute that backs large system savings from single-payer plans.
Community Note editors flagged the post for missing context. They pointed out that the Congressional Budget Office (CBO) has not endorsed a fixed $1.3 trillion cut. They also stressed that federal spending would rise under many single-payer designs, even if national costs fell. Conservative outlets amplified that point and said the Yale estimate was not peer reviewed in the sources they cited.
What The Congressional Budget Office Actually Says
The Congressional Budget Office modeled several single-payer designs. The agency reported that total national health spending in 2030 could decrease by up to $0.7 trillion or increase by up to $0.3 trillion, depending on choices like payment rates and covered benefits. CBO also said federal health subsidies would increase by roughly $1.5 trillion to $3.0 trillion under its options, shifting private payments onto the federal ledger and raising deficit risks if taxes do not rise.
CBO identified the main drivers on both sides. Lower provider payment rates and reduced administrative tasks tend to cut spending. Increased use of care, especially if long-term services and supports are covered, tends to raise spending. Those trade-offs explain why credible models land on different totals. Policymakers must choose which levers to pull and which costs to carry at the federal level.
The Core Confusion: National Spending Versus Federal Spending
Khanna’s message focused on national spending, which adds up all public and private health costs. The Community Note focused on federal spending, which is only what Washington pays. Those are different lines on the ledger. A plan can lower what the nation spends overall while still making the federal government spend a lot more and collect more taxes to pay the bills. CBO’s materials separate these measures for this reason.
That split feeds public distrust. Voters hear “savings” and expect lower taxes or cheaper bills. But savings in the national total may come with higher taxes, new payroll charges, or changes to take-home pay. Without a clear, public financing plan that shows who pays what, both right and left suspect that powerful interests will push the costs onto regular families while keeping their own gains.
How Much Of Khanna’s Number Is Verified?
Khanna’s $1.3 trillion figure lines up with the idea that cutting overhead and drug prices can save money. But the available reporting ties it to a Yale preprint that is not provided for public review in the cited coverage. That leaves open key questions about the exact design it modeled, its assumptions, and how it handled higher use of care. The lack of a public model and a formal score creates a gap in the evidence chain.
By contrast, CBO and RAND publish designs and trade-offs. RAND found that one comprehensive plan with long-term care would raise total spending by 1.8 percent in 2019, and could rise 9.8 percent with no supply limits. It also projected a large jump in federal spending under that design. Those results do not settle the debate, but they show how design choices drive very different outcomes.
What Matters For Families And For Accountability
Two questions decide whether Medicare for All cuts your bill: what changes in the national total and how the plan raises federal money. A plan can trim waste and drug prices yet still raise taxes more than it lowers premiums and out-of-pocket costs. Lawmakers owe the public a full financing map that shows taxes, wages, premiums, and wait times under their exact rules. That is basic accountability that both parties should demand.
Bottom Line
Khanna is right that some models show big national savings. CBO is clear that outcomes vary and that federal costs rise without offsetting revenue. Until sponsors release full designs and ask CBO for a formal score that shows both national and federal effects, the $1.3 trillion claim remains a headline, not a settled fact. In a system many view as built to serve insiders, clarity is not a luxury; it is the test of who the plan is really for.
Sources:
twitchy.com, sandersinstitute.org, commondreams.org, cbo.gov, collections.awsprod.nlm.nih.gov, townhall.com, rand.org
© dailychive.com 2026. All rights reserved.